返回首页

Octoverse 2026:9 月超 40% PR 由 Agent 发起,Copilot 多模型使用升至 61%

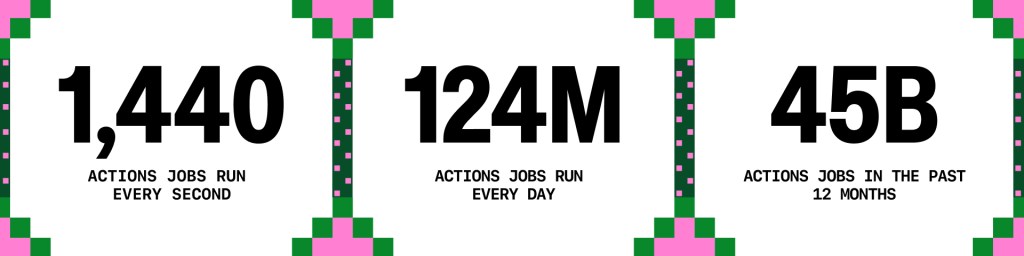
  • 年度数据:过去 12 个月 GitHub 推送 179 亿次,超过 2024 与 2025 年合计;提交 343 亿次,合并 PR 13 亿个,Actions 运行 454 亿个作业。
  • Agent 占比:9 月超过 40% 的 PR 由 Agent 发起首版,较 3 月的 17% 提升;当月 Agent 发起 1.1 亿个 PR,约为 3 月的 6 倍。今年新建仓库中,带 Agent 配置文件的仓库平均提交量是无配置文件仓库的 8 倍。
  • Copilot 使用:55% 的 Copilot 月活用户使用 Agent 功能,较一年前 35% 提升;Copilot cloud agent 同比增长 230%。9 月 61% 自行选择模型的 Copilot 用户使用多个模型,付费用户用到 47 个不同模型,单一模型请求占比不超过 25%。
  • 开发者与语言:GitHub 开发者超过 2.25 亿;TypeScript、Python、Rust 的合并 PR 中 AI 参与比例约 40%–44%,Java、C#、C++ 约 21%–34%。
  • 行业意义:报告把 Agent 的使用从“是否采用”推进到 PR 发起、云 Agent 任务与多模型路由的占比;对工具链团队,审查、会话连续性与模型选择成本已成为与生成能力同等重要的指标。 🔗 Octoverse 2026 官方报告
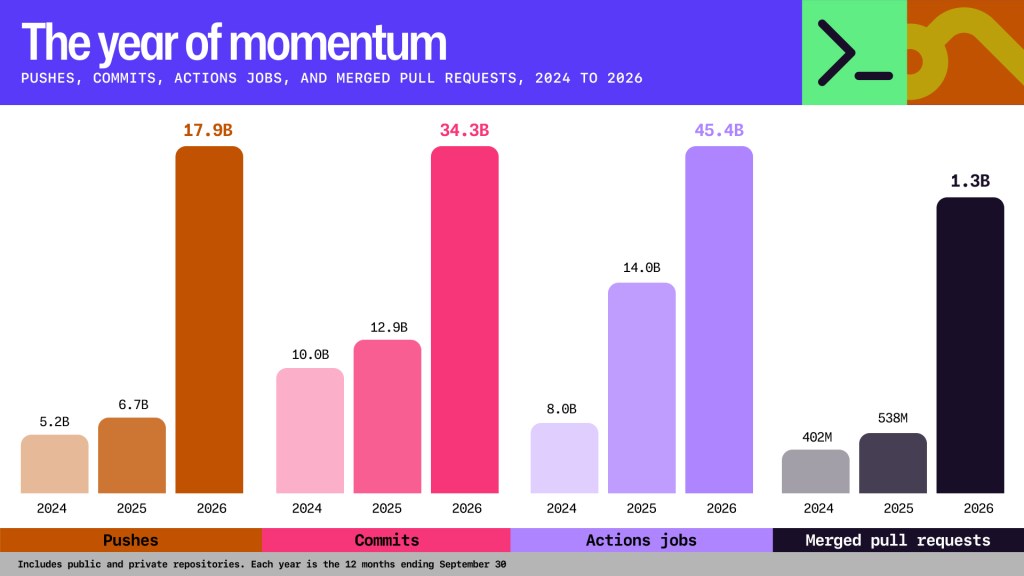
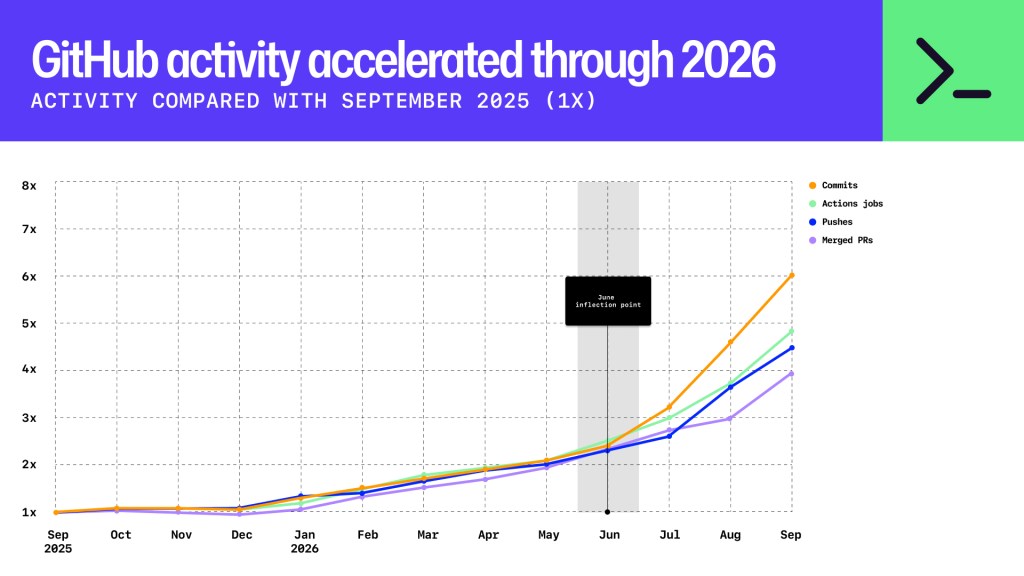
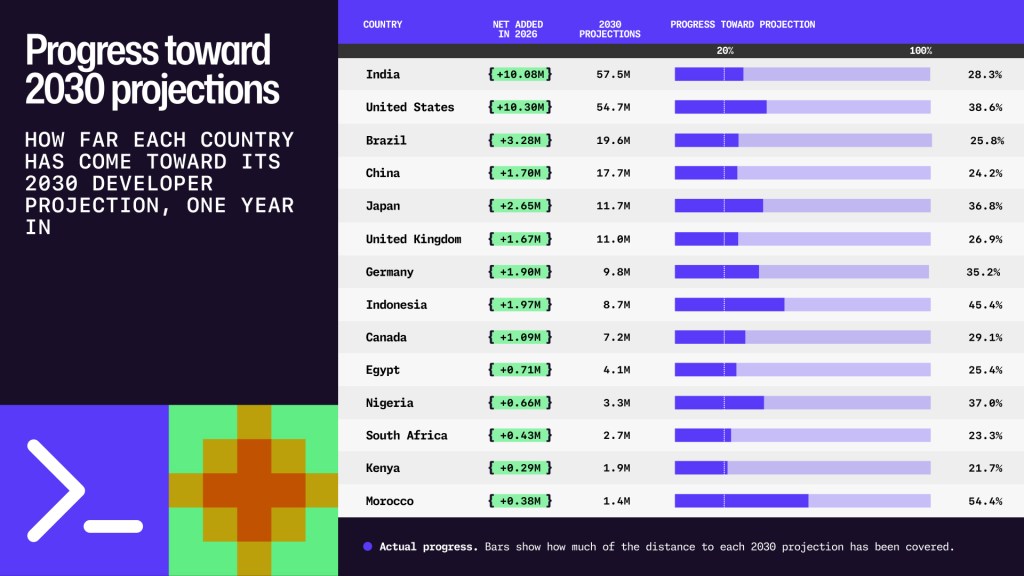
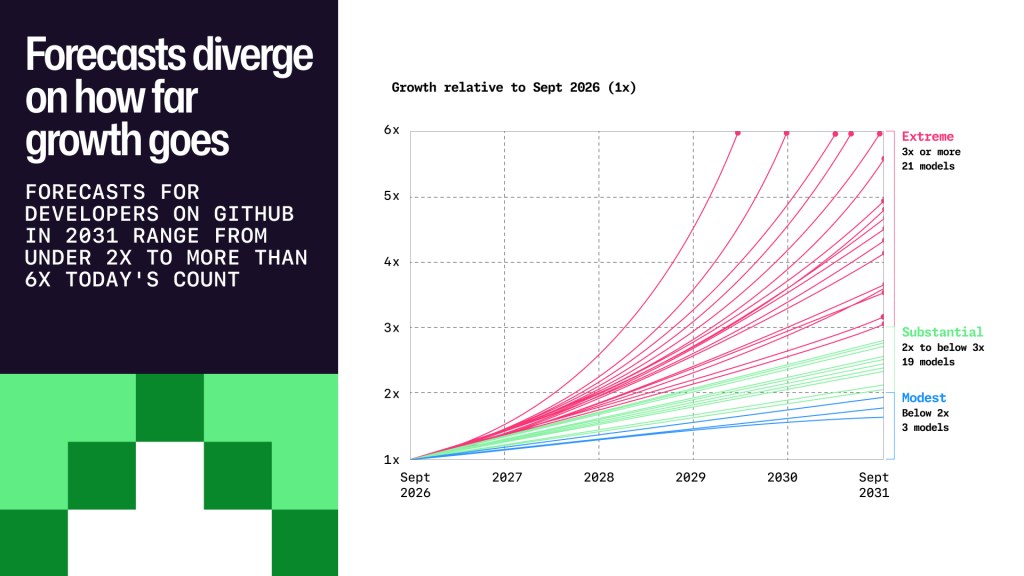
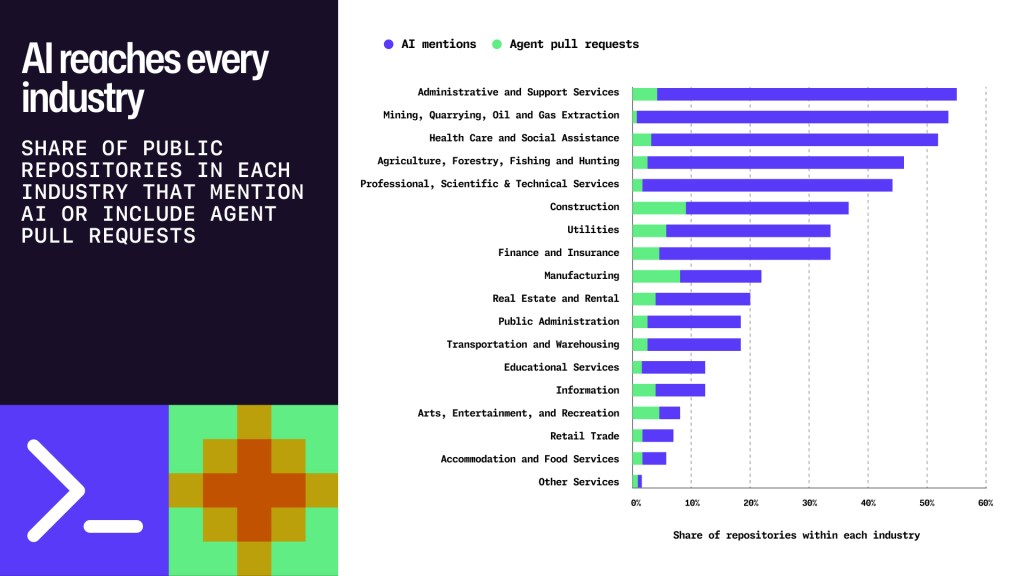
Bar chart titled “The year of momentum” showing growth from 2024 to 2026 in GitHub activity. Pushes increased from 5.2B to 6.7B to 17.9B; commits from 10.0B to 12.9B to 34.3B; Actions jobs from 8.0B to 14.0B to 45.4B; and merged pull requests from 402M to 538M to 1.3B. Figures include public and priThree panels report GitHub Actions job volume: 1,440 jobs run every second, 124 million run every day, and 45 billion ran in the past 12 months. The panels have white backgrounds with pink and green pixel-style borders.Line chart titled “GitHub activity accelerated through 2026,” comparing monthly activity with September 2025 (1×). From September 2025 to September 2026, commits rise to 6×, Actions jobs to about 4.8×, pushes to about 4.5×, and merged pull requests to about 3.9×. All four series accelerate sharply aTable titled “Progress toward 2030 projections” compares net developers added in 2026 with each country’s projected developer population in 2030, showing progress one year into the projection. Morocco is furthest along at 54.4%, followed by Indonesia at 45.4%; Kenya is least far along at 21.7%. TheLine chart showing 43 forecasts for GitHub developer growth from September 2026 to September 2031, with all starting at 1×. By 2031, 21 models project extreme growth of 3× or more (some above 6×), 19 project substantial growth of 2× to under 3×, and 3 project modest growth below 2×.Horizontal bar chart titled “AI reaches every industry,” showing the share of public repositories in each industry that mention AI (purple) or include agent pull requests (green). Combined bars are longest for administrative and support services and mining, at about 55% each, followed by health care